Skip to main content
Browse Items
Browse Collections
Browse Exhibits
About
HIST 270: Mexico City
Using Omeka: Creating a simple page
Map
Neatline
Map
DH Sandbox
DH Sandbox
Browse Items
Browse Collections
Browse Exhibits
About
HIST 270: Mexico City
Using Omeka: Creating a simple page
Map
Neatline
Map
Search using this query type:
Keyword
Boolean
Exact match
Search only these record types:
Item
File
Collection
Advanced Search (Items only)
Submit
DH Sandbox
Browse Items (165 total)
Browse All
Browse by Tag
Search Items
Tools
of 17
Sort by:
Title
Creator
Date Added
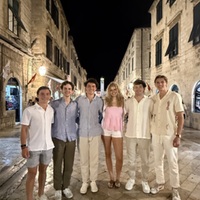
Croatia with family
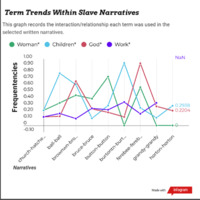
Data Visualization 1
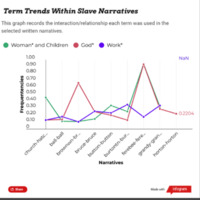
Data Visualization 1- Term Trends
This Graph records the interaction/relationship of each term used in the selected written narratives.
Data Visualization 2: Bar Graph
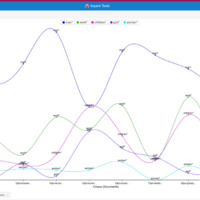
Data Visualization- Trending Chart Simplified
A More Simplified Trending Chart. Combine the Women* and Children* lines to easily compare with the other components.
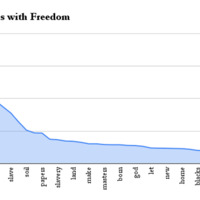
Data Visualization: Associations with Freedom
Associations with Freedom
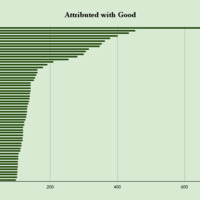
Data Visualization: Associations with Good vs Bad
Associations with Good vs Bad in Narratives
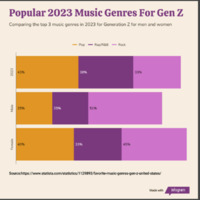
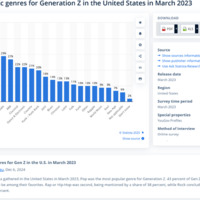
Data Viz: Inspiration: Music Genre Among Zoomers
A bar graph displaying the results of the most favored types of music among Gen Z in March '23
Degrees of connection in political books
Box plot showing the distribution of connections by political ideology
Disney
Disney is a place I go with my family. We love to go to Florida every year as a family. It's a tradition we have.
of 17
Output Formats
atom
,
dcmes-xml
,
json
,
omeka-xml
,
rss2